import numpy as np
import networkx as nx
import matplotlib.pyplot as pltsummary
모든 노드가 동일한 degree를 갖는 그래프, degree matrix가 \(I\)나 \(kI\)로 나타낼 수 있는 그래프
degree matrix: the degree matrix of an undirected graph is a diagonal matrix which contains information about the degree of each vertex—that is, the number of edges attached to each vertex.
Import
Regular Graph
definition of wiki: each vertex has the same number of neighbors; i.e. every vertex has the same degree or valency.
모든 node가 동일한 degree를 갖는 그래프
Tip
Tip for future work
이것은 시계열에서의 Graph Shift Operator로써 볼 수 있지.1
1 단, 단위행렬일때, 단위행렬의 배수가 아니라.
w=np.zeros((5,5))
for i in range(5):
    for j in range(5):
        if i==j :
            w[i,j] = 0
        elif i-j == 1 :
            w[i,j] = 1
        elif j-i == 4 :
w[i,j] = 1warray([[0., 0., 0., 0., 1.],
[1., 0., 0., 0., 0.],
[0., 1., 0., 0., 0.],
[0., 0., 1., 0., 0.],
[0., 0., 0., 1., 0.]])lst = []
for i in range(5):
for j in range(5):
if w[i,j] == 1:
lst.append([i,j])np.array(lst)array([[0, 4],
[1, 0],
[2, 1],
[3, 2],
[4, 3]])동일한 차수를 갖는다?
Note
참고로, 무조건 degree matrix가 단위행렬일 필요는 없고 \(D = kI\)가 성립해도 Regular Graph
d= w.sum(axis=1)
D= np.diag(d)Darray([[1., 0., 0., 0., 0.],
[0., 1., 0., 0., 0.],
[0., 0., 1., 0., 0.],
[0., 0., 0., 1., 0.],
[0., 0., 0., 0., 1.]])G = nx.Graph()G.add_edges_from(np.array(lst))plt.figure(figsize=(10, 10))
nx.draw_networkx(G, with_labels=True, font_weight='bold', node_color='orange', node_size=1500, font_color='white', font_size=30,width=5)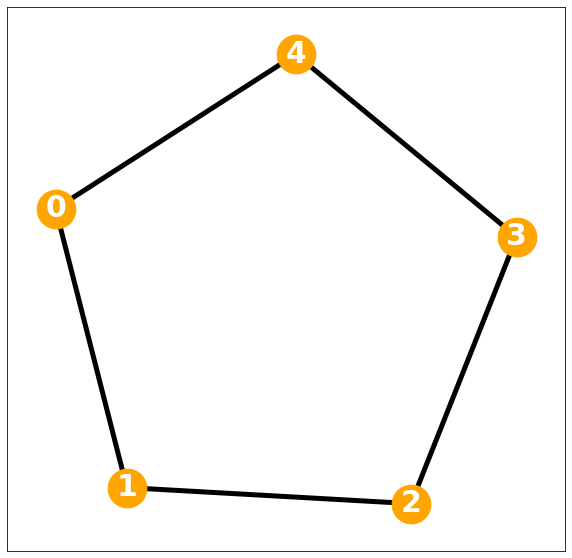
Non-Regular Graph
w = np.array([[0., 0., 0., 0., 0.],
       [1., 0., 1., 1., 1.],
       [1., 1., 0., 0., 1.],
       [0., 0., 1., 0., 1.],
       [0., 0., 0., 0., 0.]])
lst = []
for i in range(5):
for j in range(5):
if w[i,j] == 1:
lst.append([i,j])np.array(lst)array([[1, 0],
[1, 2],
[1, 3],
[1, 4],
[2, 0],
[2, 1],
[2, 4],
[3, 2],
[3, 4]])
Note
모든 Degree가 동일하는 가정이 무너져 regular graph 로 정의할 수 없음
d= w.sum(axis=1)
D= np.diag(d)Darray([[0., 0., 0., 0., 0.],
[0., 4., 0., 0., 0.],
[0., 0., 3., 0., 0.],
[0., 0., 0., 2., 0.],
[0., 0., 0., 0., 0.]])G = nx.Graph()G.add_edges_from(np.array(lst))plt.figure(figsize=(10, 10))
nx.draw_networkx(G, with_labels=True, font_weight='bold', node_color='orange', node_size=1500, font_color='white', font_size=30,width=5)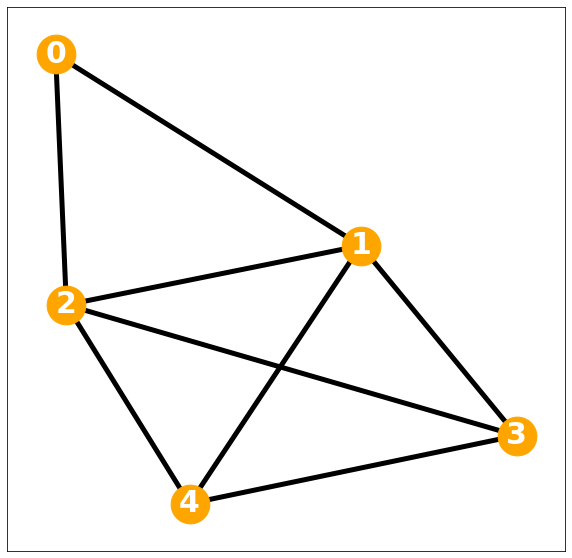
Several Types of regular graph
0-regular graph
참고 아래도 동일 차수이므로 regular graph
w = np.array([[1., 0., 0., 0., 0.],
       [0., 1., 0., 0., 0.],
       [0., 0., 1., 0., 0.],
       [0., 0., 0., 1., 0.],
[0., 0., 0., 0., 1.]])d= w.sum(axis=1)
D= np.diag(d)Degree matrix = \(I\)
Darray([[1., 0., 0., 0., 0.],
[0., 1., 0., 0., 0.],
[0., 0., 1., 0., 0.],
[0., 0., 0., 1., 0.],
[0., 0., 0., 0., 1.]])lst = []
for i in range(5):
for j in range(5):
if w[i,j] == 1:
lst.append([i,j])G = nx.Graph()G.add_edges_from(np.array(lst))plt.figure(figsize=(10, 10))
nx.draw_networkx(G, with_labels=True, font_weight='bold', node_color='orange', node_size=1500, font_color='white', font_size=30,width=5)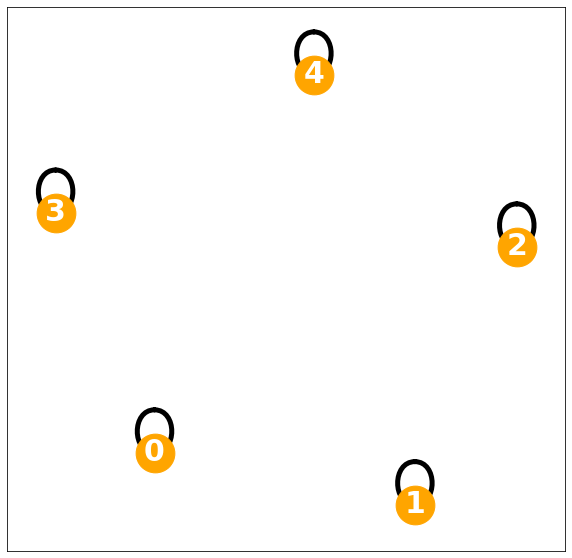
1-regular graph
w = np.array([
       [0., 1., 0., 0., 0., 0.],
       [1., 0., 0., 0., 0., 0.],
       [0., 0., 0., 1., 0., 0.],
       [0., 0., 1., 0., 0., 0.],
       [0., 0., 0., 0., 0., 1.],
[0., 0., 0., 0., 1., 0.]])d= w.sum(axis=1)
D= np.diag(d)Degree matrix = \(I\)
Darray([[1., 0., 0., 0., 0., 0.],
[0., 1., 0., 0., 0., 0.],
[0., 0., 1., 0., 0., 0.],
[0., 0., 0., 1., 0., 0.],
[0., 0., 0., 0., 1., 0.],
[0., 0., 0., 0., 0., 1.]])lst = []
for i in range(6):
for j in range(6):
if w[i,j] == 1:
lst.append([i,j])G = nx.Graph()G.add_edges_from(np.array(lst))plt.figure(figsize=(10, 10))
nx.draw_networkx(G, with_labels=True, font_weight='bold', node_color='orange', node_size=1500, font_color='white', font_size=30,width=5)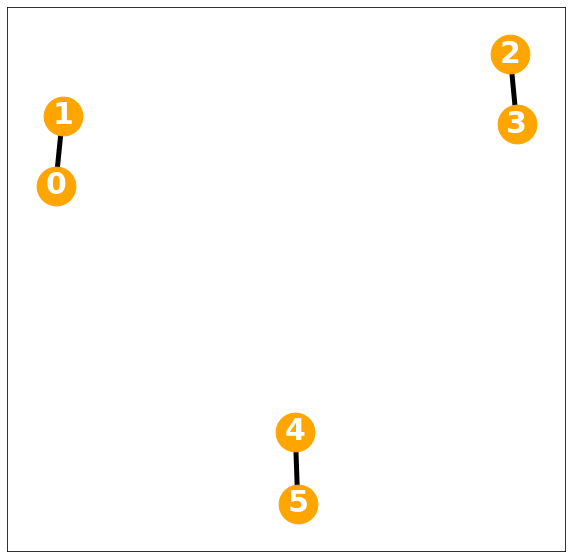
2-regular graph
w = np.array([
       [0., 1., 1., 0., 0., 0.],
       [1., 0., 1., 0., 0., 0.],
       [1., 1., 0., 0., 0., 0.],
       [0., 0., 0., 0., 1., 1.],
       [0., 0., 0., 1., 0., 1.],
[0., 0., 0., 1., 1., 0.]])d= w.sum(axis=1)
D= np.diag(d)Degree matrix = \(2I\)
Darray([[2., 0., 0., 0., 0., 0.],
[0., 2., 0., 0., 0., 0.],
[0., 0., 2., 0., 0., 0.],
[0., 0., 0., 2., 0., 0.],
[0., 0., 0., 0., 2., 0.],
[0., 0., 0., 0., 0., 2.]])lst = []
for i in range(6):
for j in range(6):
if w[i,j] == 1:
lst.append([i,j])G = nx.Graph()G.add_edges_from(np.array(lst))plt.figure(figsize=(10, 10))
nx.draw_networkx(G, with_labels=True, font_weight='bold', node_color='orange', node_size=1500, font_color='white', font_size=30,width=5)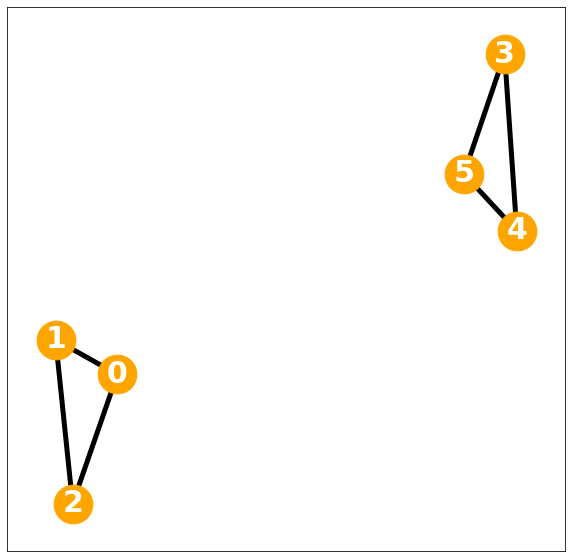
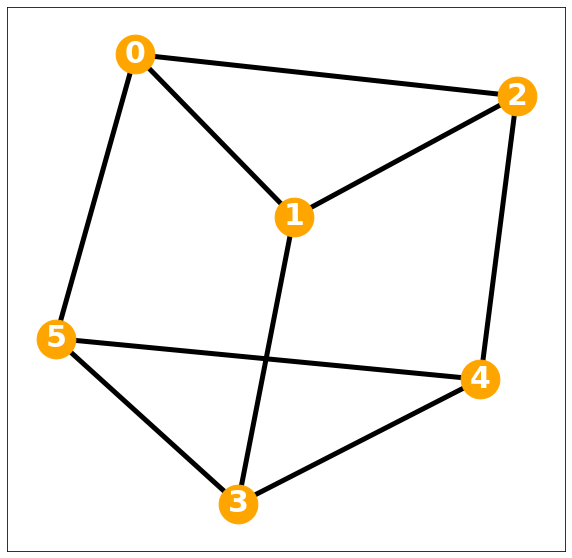
3-regular graph
w = np.array([
       [0., 1., 1., 0., 0., 1.],
       [1., 0., 1., 1., 0., 0.],
       [1., 1., 0., 0., 1., 0.],
       [0., 1., 0., 0., 1., 1.],
       [0., 0., 1., 1., 0., 1.],
[1., 0., 0., 1., 1., 0.]])d= w.sum(axis=1)
D= np.diag(d)Degree matrix = \(3I\)
Darray([[3., 0., 0., 0., 0., 0.],
[0., 3., 0., 0., 0., 0.],
[0., 0., 3., 0., 0., 0.],
[0., 0., 0., 3., 0., 0.],
[0., 0., 0., 0., 3., 0.],
[0., 0., 0., 0., 0., 3.]])lst = []
for i in range(6):
for j in range(6):
if w[i,j] == 1:
lst.append([i,j])G = nx.Graph()G.add_edges_from(np.array(lst))plt.figure(figsize=(10, 10))
nx.draw_networkx(G, with_labels=True, font_weight='bold', node_color='orange', node_size=1500, font_color='white', font_size=30,width=5)